Category: Machine Learning & Data
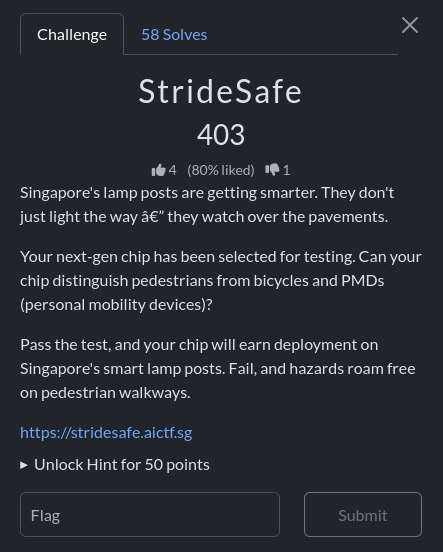
This challenge was a very good example to understand the working principle of Vision-Language Models.
If we view the Page Source, we will find this hint.
<!– TODO: Test on other vision-language models other than OpenAI CLIP –>
Good hint but keep going and the download the data.
import numpy as np
import matplotlib.pyplot as plt

results_arr = np.array(results)
size = int(np.sqrt(len(results_arr)))

plt.figure(figsize=(3,3))
plt.imshow(1 - results_arr.reshape((size, size)), cmap="gray")
plt.axis('off')
plt.show()
The deploy-script.py file in the downloaded data shows us that we have 1089 JPEG images, and deploy-script.py expects an array named results corresponding to these images. This array is converted into a square matrix (size = sqrt(len(results))) and visualized with imshow(1 - results_arr.reshape((size,size))). This process indicates that the results content will form a visual pattern (probably a barcode).
Since 1089 = 33², the matrix will be 33×33. So, our goal is to make a 0/1 (safe/dangerous) decision for each image and obtain a 33×33 binary image. This confirms that the resulting image is a barcode.
Solution Approach
Automatically classify each image (hazard vs. safe) and generate a set of results. The challenge contained the following hint. So, the solution was based on the OpenAI CLIP model. To perform this classification without training a CNN from scratch, we used a zero-shot Vision-Language Model (OpenAI CLIP). CLIP generates a similarity score between an image and its text description, allowing for rapid classification of texts like “a photo of a person walking” vs. “a photo of a bicycle“.
1. Model Initialization
os, numpy, PIL, tqdm, torch, clip: Environment, numeric operations, image opening, progress bar, PyTorch, and CLIP libraries.- Clip is installed from the repo
(pip install git+https://github.com/openai/CLIP.git).
2. Defining Text Prompts
hazard_texts = [
    "a photo of a bicycle",
    "a photo of an electric scooter",
    "a photo of a person riding a bike"
]
safe_texts = [
    "a photo of a pedestrian",
    "a person walking on a sidewalk"
]

texts = hazard_texts + safe_texts
text_tokens = clip.tokenize(texts).to(device)
with torch.no_grad():
    text_features = model.encode_text(text_tokens)
    text_features /= text_features.norm(dim=-1, keepdim=True)
At this stage, I realized that the prompt written for the QR code needed more general definitions to be as desired.
CLIP model represents both images and texts in the same vector space. Here, we define two groups of prompts: “hazard” and “safe.” Then, the encode_text() function converts these textual prompts into 512-dimensional embedding vectors. Afterward, the L2 normalize step ensures that all vectors have unit length, allowing cosine similarity to be computed directly as a dot product.
3. Image Loading and Ordering
files = sorted([f for f in os.listdir("data") if f.endswith(".jpg")])The visualization depends on mapping the predictions into a 33×33 grid.
4. Image Encoding and Similarity Scoring
results = []
for fname in tqdm(files):
    img = Image.open(os.path.join("data", fname)).convert("RGB")
    image_input = preprocess(img).unsqueeze(0).to(device)
    with torch.no_grad():
        image_features = model.encode_image(image_input)
        image_features /= image_features.norm(dim=-1, keepdim=True)
        similarities = (image_features @ text_features.T).squeeze(0).cpu().numpy()
For each image, the CLIP model first extracts its feature vector. Then, this vector is compared with the text embeddings using a dot product, producing similarity scores for each prompt. The higher the score, the more semantically aligned the image is with that textual concept.
5. Decision Logic & Visualization
    hazard_score = max(similarities[:len(hazard_texts)])
    safe_score = max(similarities[len(hazard_texts):])
    results.append(1 if hazard_score > safe_score else 0)

results_arr = np.array(results)
size = int(np.sqrt(len(results_arr)))
plt.imshow(1 - results_arr.reshape((size, size)), cmap="gray")
plt.axis('off')
plt.show()
In the interpretation phase, a decision rule is applied using the similarity scores from CLIP: if an image is closer to “hazard” prompts, it is marked as 1; otherwise, as 0. The binary outputs from all 1089 images form a 33×33 matrix. When visualized, this matrix reveals a hidden pattern — typically a QR code or readable text — which encodes the flag information.
You can find the full code here.
Finally, when we complete the code that gives the flag, we can see that a QR code has been created and when we scan this QR code, we get the flag.
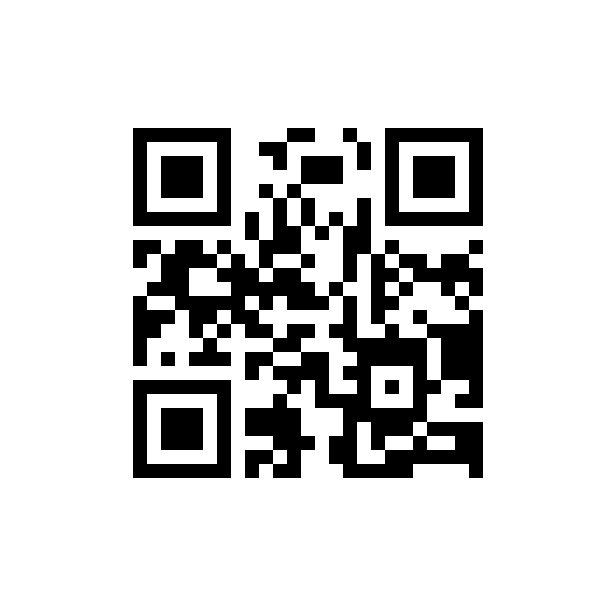
You can use any of barcode scanner for result.
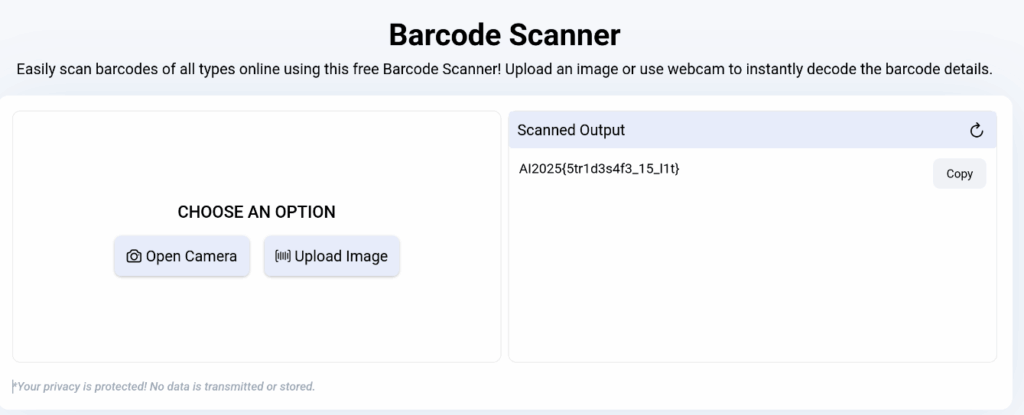
FLAG: AI2025{5tr1d3s4f3_15_l1t}